

VGG16モデルの特徴マップを可視化してみた

VGG16とは

畳み込み13層とフル結合3層の計16層から成る畳み込みニューラルネットワークのこと。
2014年のILSVRC(ImageNet Large Scale Visual Recognition Challenge)という画像分類のコンペで提案された。
構成は以下の図を参照。
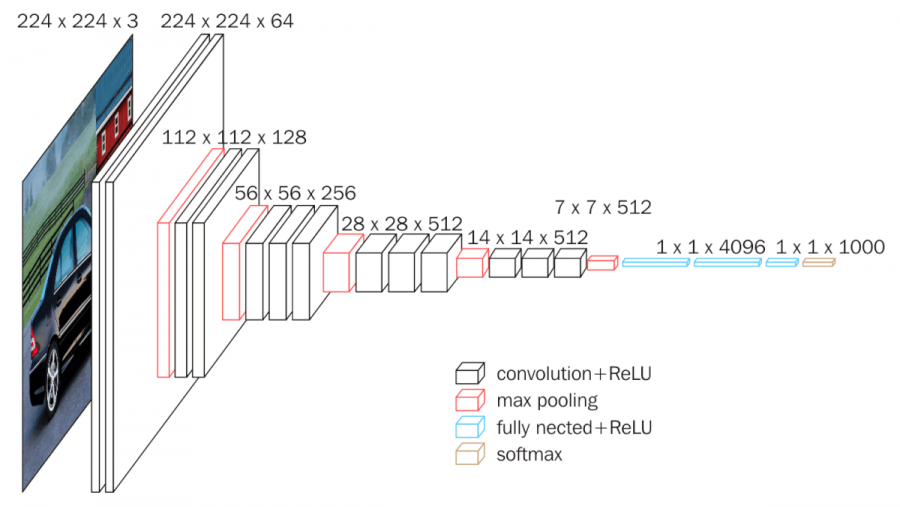
可視化する
実際に特徴マップを可視化していく。
- VGG16学習済みモデル
- 特徴抽出したい画像
を用意するだけで可視化できる。学習済みモデルに関してはimportすれば自動でダウンロードしてくれる。便利。
特徴マップの選択
- Convolution Layer
- Pooling Layer
の2種類を可視化する。
入力に使う画像
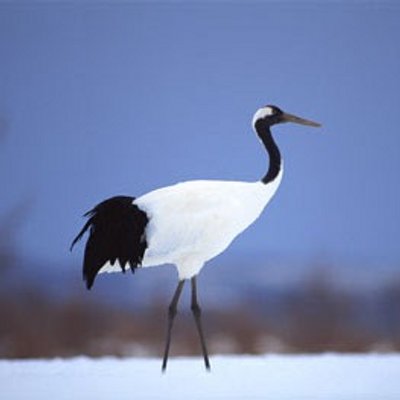
今回はツルの画像を使う。というのも鳥系の画像は特徴マップが比較的みやすいからね。
ソースコード
画像の読み込み
    # NOTE: Load image.
    img = image.load_img(args.img, target_size=(224, 224))
    img = image.img_to_array(img)
    img = np.expand_dims(img, axis=0)
    img = preprocess_input(img)
    print("IMAGE FILENAME: %s" % os.path.basename(args.img))
学習済みモデルのロード
    # NOTE: Load trained model.
    print("[status] Loaded model...")
    if args.model is not None:
        model = load_model(args.model)
    elif not (args.model_json is None or args.model_weight is None):
        model = model_from_json(open(args.model_json).read())
        model.load_weights(args.model_weight)
    else:
        model = VGG16(weights="imagenet")
出力する層の選択(Convolution and Pooling Layer)
    # NOTE: Select output layer and predict.
    print("[status] Extract input image features...")
    layers = model.layers[1:19]
    layer_outputs = [layer.output for layer in layers]
    activation_model = models.Model(inputs=model.input, outputs=layer_outputs)
    # activation_model.summary()
    activations = activation_model.predict(img)

    # NOTE: Select visualize layers.
    conv_and_pool_activations = []
    for layer, activation in zip(layers, activations):
        is_pooling_layer = isinstance(layer, MaxPooling2D)
        is_convolution_layer = isinstance(layer, Convolution2D)
        if is_pooling_layer or is_convolution_layer:
            conv_and_pool_activations.append([layer.name, activation])
特徴マップをヒートマップに変換して保存
    # NOTE: Generate heatmap.
    print("[status] Generating heatmaps...")
    os.makedirs(args.directory, exist_ok=True)
    for i, (name, activation) in enumerate(conv_and_pool_activations):
        print("[status] Processing %s layer..." % name)
        n_imgs = activation.shape[3]
        n_cols = math.ceil(math.sqrt(n_imgs))
        n_rows = math.floor(n_imgs / n_cols)
        screens = []
        for y in range(0, n_rows):
            rows = []
            for x in range(0, n_cols):
                j = y * n_cols + x
                if j < n_imgs:
                    featuremap_img = activation[0, :, :, j]
                    rows.append(featuremap_img)
                else:
                    rows.append(np.zeros())
            screens.append(np.concatenate(rows, axis=1))
        screens = np.concatenate(screens, axis=0)
        plt.figure()
        sns.heatmap(screens, xticklabels=False, yticklabels=False)
        save_name = "%s.png" % name
        save_path = os.path.join(args.directory, save_name)
        plt.savefig(save_path)
        plt.close()
    print("[status] Generating heatmap has finished...")
出力結果
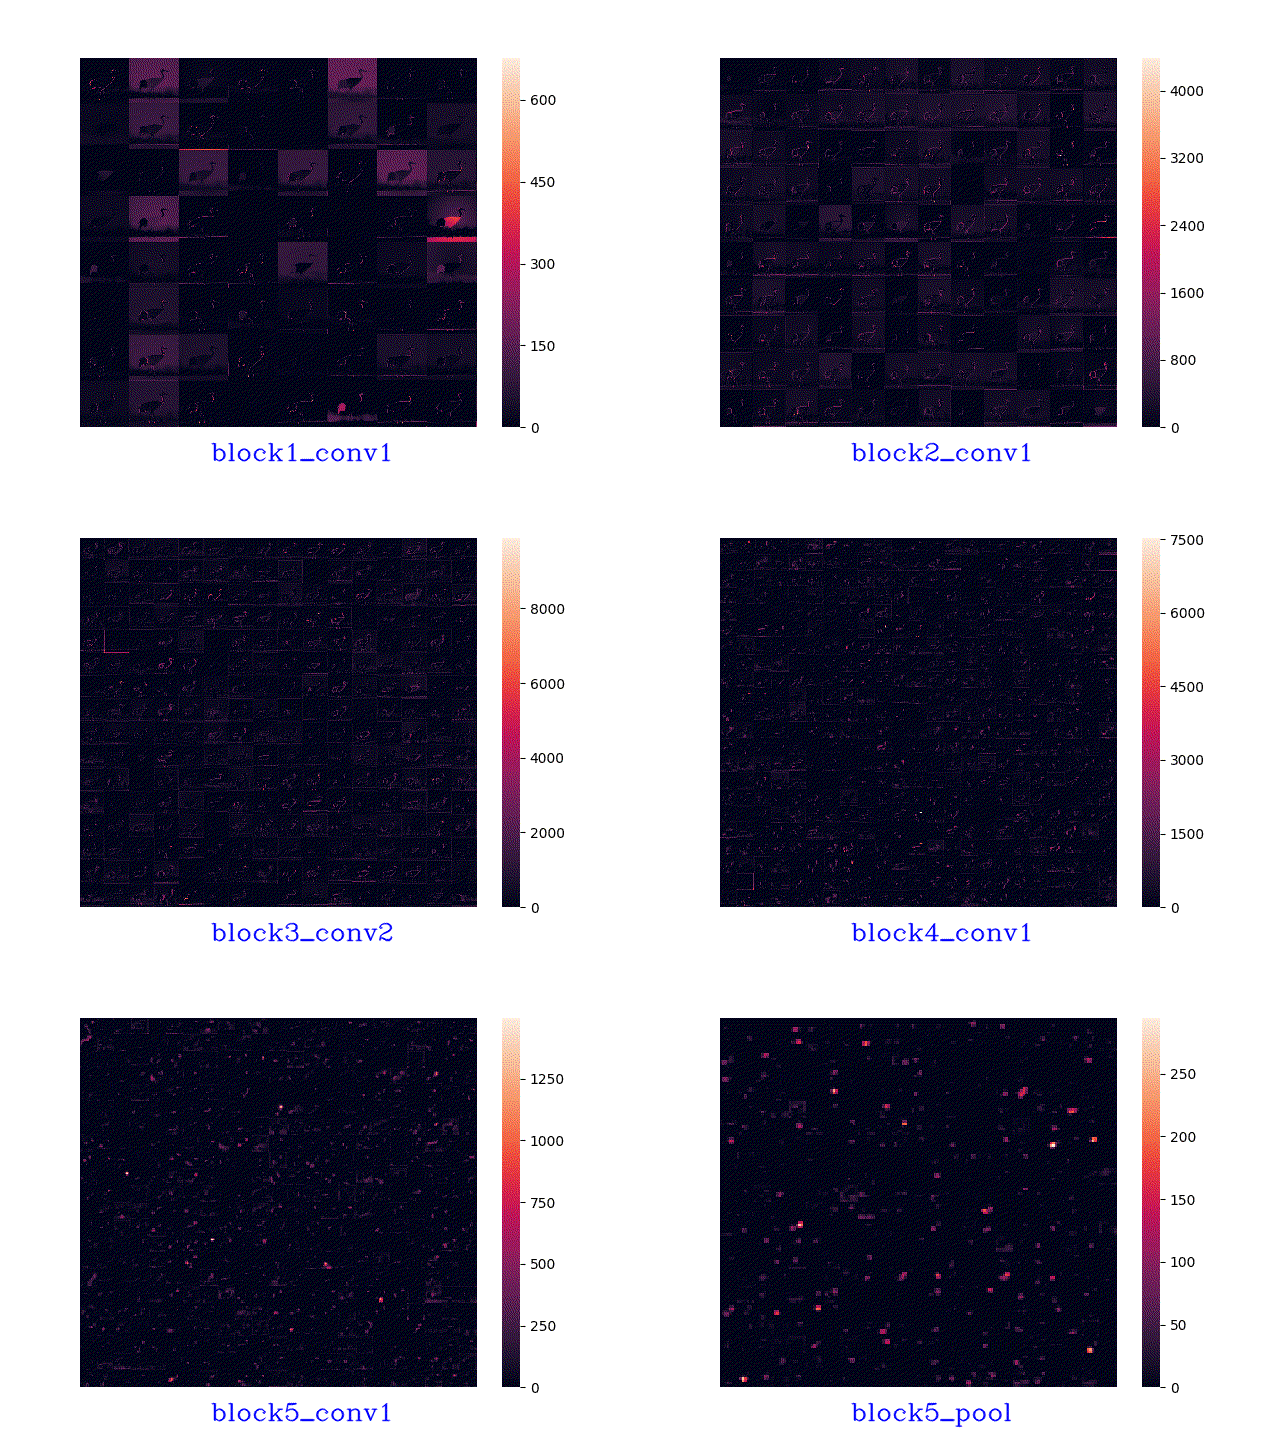
Layerが進に従って画像は小さくなり、特徴も大まかになっている。これだけじゃイマイチ分からないので、特徴強度の中から平均強度が最も高い特徴強度を選んでみた。
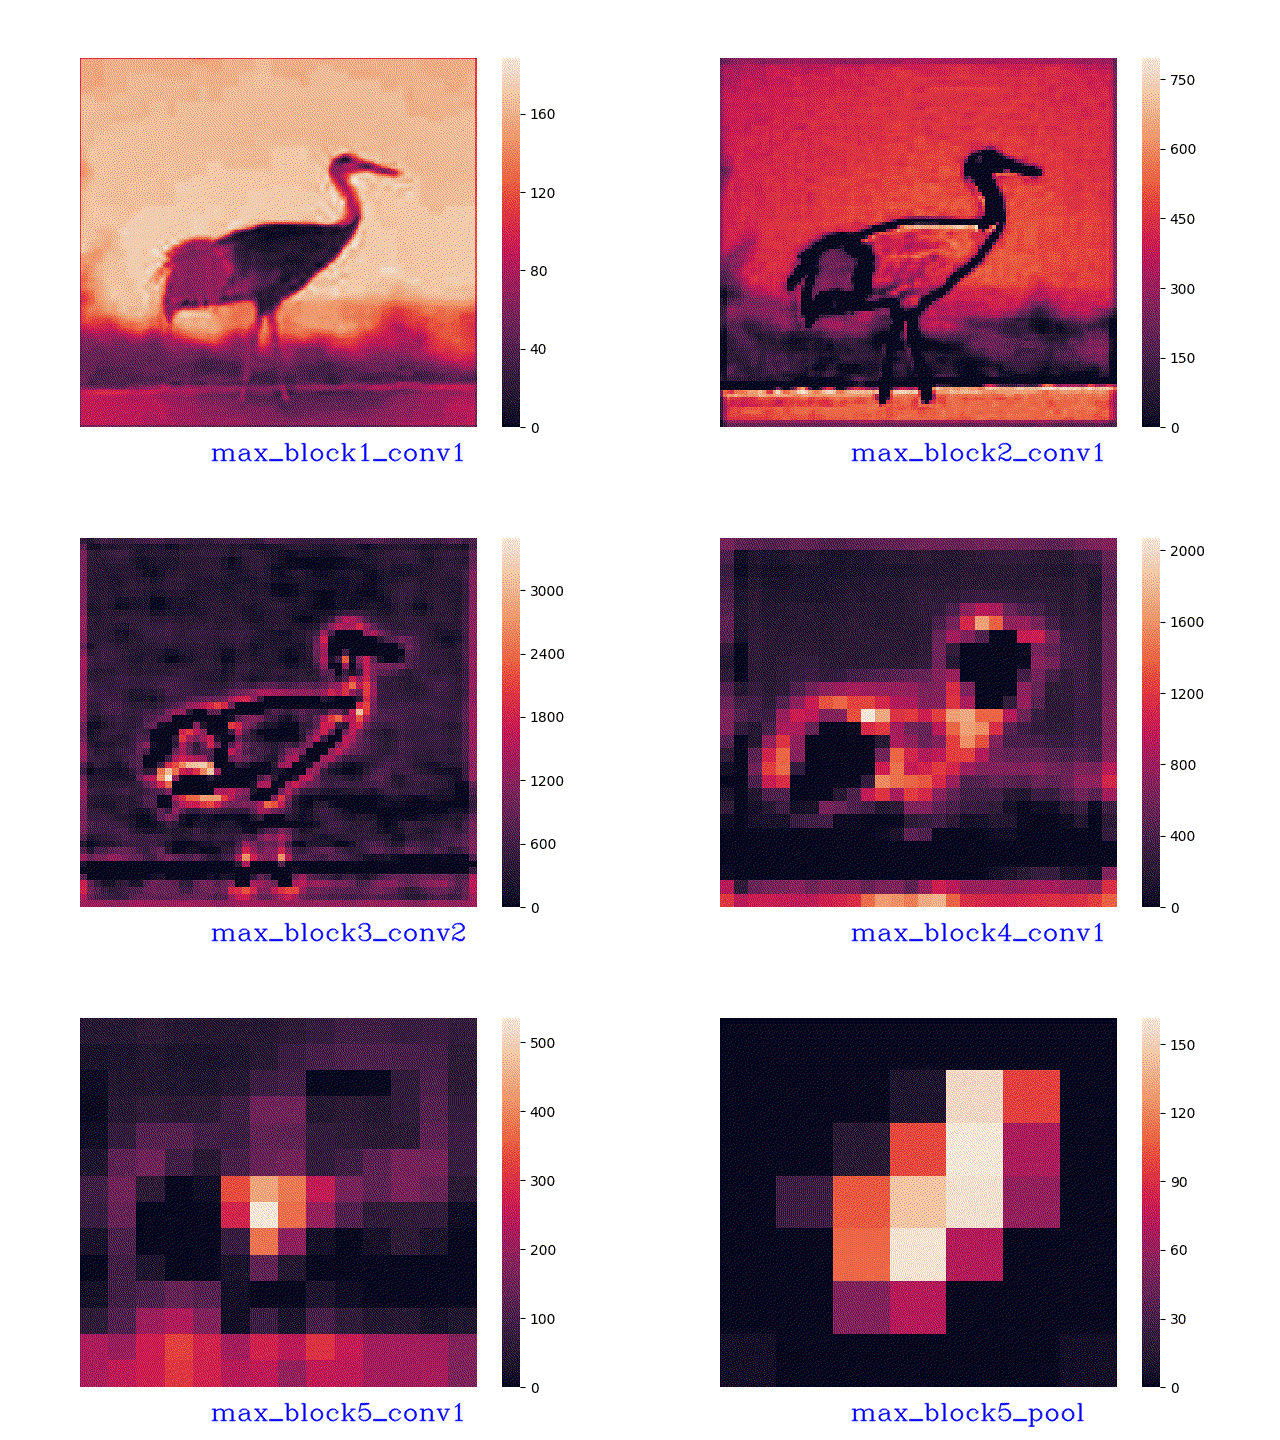
最後は大まかな特徴を捉えられている。すごい。
終わりに
VGG16の特徴マップを可視化しました。
今回使用したコードはGitHubにアップしていますのでご自由にお使いください。
github.com
